
Finally, after years of programmatically putting togehter figures with multiple axis, I created a class based approach for creating figures with multiple y axis. This allows easier customization and usage for GUI programming. I have procrastinated this problem since 2009, basically since I’m using MATLAB.
This is an object orientated approach for creating plots with three or more y axis. myaxisc, short for “Multiple Y Axis Class”, is a class holding all the axes objects needed to display multiple Y axis. Second axis is placed on the right side, the additional axes are placed on the left side.
Features
- As much Y Axis as needed (as long as there is enough space left)
- App Designer, Regular Figure and GNU Octave Compatibility
- Modified Axestoolbars and UIFigure-Buttons for Zoom and Pan
- Some basic methods for easy modifications
Usage
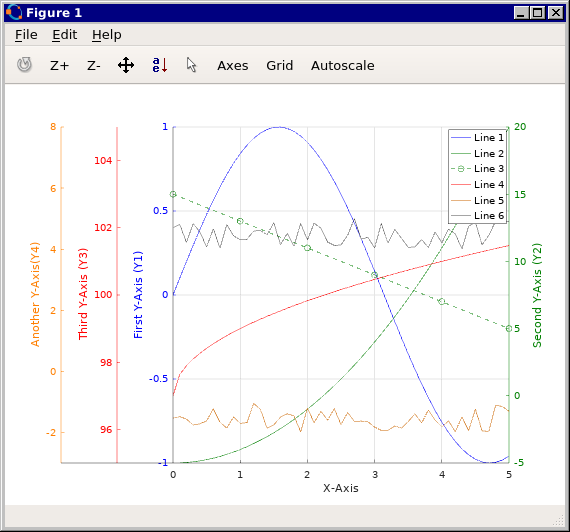
Usage in regular Figures: Create myaxisc-object “h” and call plot with specified axes to plot into:
h = myaxisc(4,0.1); % Create myaxisc-object "h" with 4 y axes and a spacing of 0.1
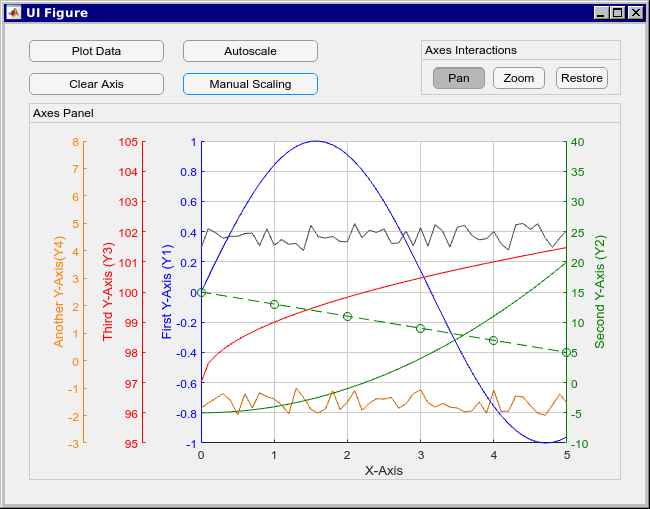
plot(h.p(3),x,y) % Create plot in third axes using method "p"Usage in App Designer: Its recommended to create a container panel to put the axes into. Use startupFcn to then create the axes into the container panel. See the attached example file for details. You need to add some functions and properties and also implement the buttons by yourself.
Screenshots
Download
Download: myaxisc-v1.5.1.zip
Download at Mathworks FileExchange